Smartwatches track plenty of health data. How much of it is actually useful?
SOURCE:Sydney Morning Herald|BY:Liam Mannix
Most modern smartwatches offer countless insights into how our bodies perform. But what is this data really telling us about our health? And how can we make the most of it?
Stefanos Sifandos has access to just about every recovery toy available.
But before the chief wellness officer at P3 Recovery straps on his self-inflating compression trousers or ventures into the hyperbaric oxygen chamber, he needs to answer a central question: how is his recovery tracking?
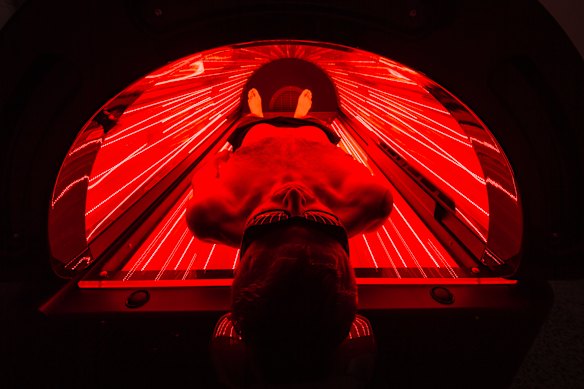
Naum Sekulovski inside a red light therapy bed at P3 Recovery Centre in Richmond.Credit: Justin McManus
Exercise is the deliberate stressing of, to the point of minor damage, our bodies. Micro-tears open across our muscles. Inflammatory cascades begin. If done right, we wake the next day aching, as our bodies begin to adapt and grow stronger.
But how do we know when adaptation has occurred, and when we are ready to go again? Sifandos turns to the metrics at his wrist, tracked by his smartwatch. “They’re great at showing trends – sleep duration, heart-rate variability, resting heart rate,” he says. These three metrics, as well as sleep quality, he says, “tend to be the most useful”.
Most modern smartwatches give you this data; some now combine various data points into sleep, recovery (Whoop) or readiness (Fitbit and Pixel) scores.
But what is this data really telling us about our health? And how can we make the most of it?
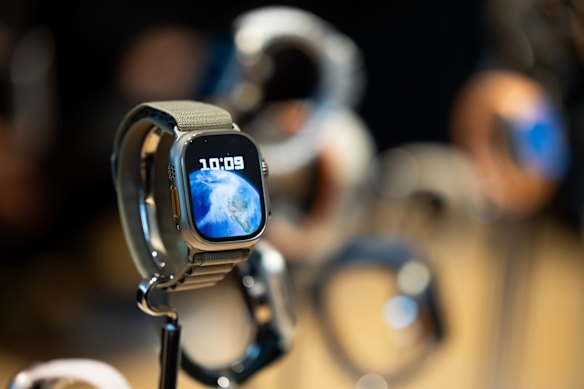
An Apple Inc. Watch Ultra 2 smartwatch on display at an Apple store.Credit: Bloomberg
Heart rate, resting heart rate, and heart rate variability
Our hearts sit roughly in the centre of our chest, beating about 100,000 times a day. Each beat pushes about 70 millilitres of blood, about a quarter of a baking cup. The average person has a heart rate around the high-70s.
Loading
David Scott, an associate professor at the Institute for Physical Activity and Nutrition, pays close attention to both his heart rate during training and at rest (his Garmin smartwatch tracks it between 45 and 50).
A meta-review of 87 studies of resting heart rate, published in 2017, found every 10-beat-per-minute increase in resting heart rate increased the risk of heart disease, stroke, heart failure and cancer by around 10 per cent, and increased all-cause mortality risk by 17 per cent.
But there’s a lot of individual variation within the “average” resting heart rate. Younger, female hearts beat a little slower than older, male hearts, for example.
And don’t try to compare your resting heart rate with your friends, Scott says. “We’re all getting older. Maintaining the same resting HR, rather than improving it, is still an improvement.”
If you put your finger to your pulse, it feels steady and rhythmic. But under close examination, the rhythm reveals minute variation – literally between every heartbeat.
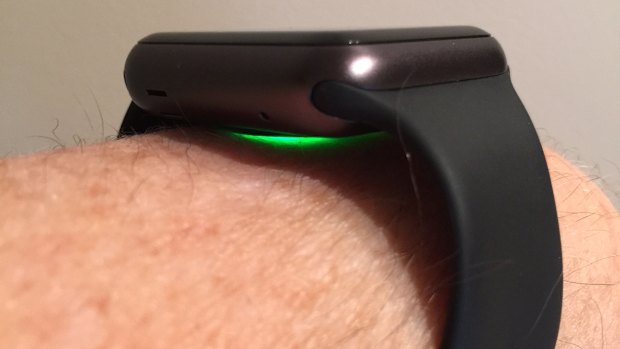
The Apple Watch emits a green light when measuring the wearer's heart rate.Credit: SMH / Supplied
Why? Because of the way the heart is wired up. The heart beats in response to electrical signals from the nervous system. The two halves of our nervous system – the sympathetic and parasympathetic – are designed to be in constant tension with each other.
The parasympathetic nervous system is our brake, always pulling us towards calmness and tugging our heart rate down (when the parasympathetic nerve is cut during a heart transplant, heart rhythm rapidly accelerates). The sympathetic nervous system is our accelerator, looking for stress, primed to trigger our fight or flight response.
Loading
“There’s always a tension between the two. If heart rate variability is high, that’s a really robust nervous system,” says Dr Kegan Moneghetti, head of cardiovascular clinical services at the Baker Heart and Diabetes Institute. “Having a higher heart rate variability is good for the heart, and good for the body.”
Higher heart rate variability is a sign both sides of the nervous system are in robust health. As we become more stressed, our sympathetic nervous system grows more active, and our heart rate variability falls: researchers consistently see lower HRV in people who are sick. It’s a sensitive metric, pushed up by exercise and down by alcohol, weight gain, or job stress.
And it is an excellent measure of how well your body is adapting to training, says Professor Andrew McKune, senior adviser on recovery to the Australian Institute of Sport. Generally, the average weekend athlete will see their HRV increase after training, as their bodies adapt to stress. But if they approach exhaustion-levels of exercise, their HRV will fall, only rebounding after a big rest-break.
“For myself – as much as I can be a bit of a sceptic for these – it does seem to be a pretty good indicator of when I’m going to get sick. I can see it trending down for three or four days, and I’ll say ‘uh oh’ to my wife,” says David Scott.
But he and other experts caution against reading too much into the exact HRV your smartwatch spits out. McKune typically spends a month monitoring an athlete’s HRV to work out the baseline. Your individual trend – up or down – is what matters.
“It’s one component you might look at with interest. But we don’t say your HRV is 20, you need to do this and this,” says Moneghetti.
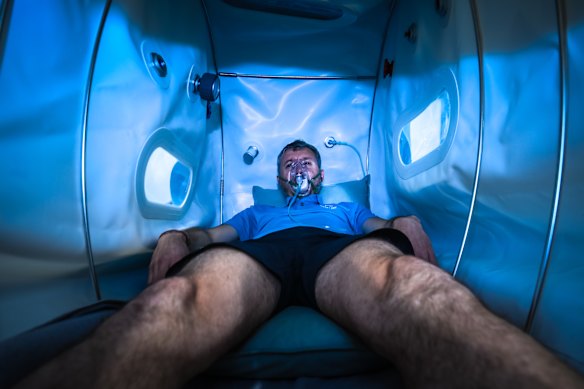
Sekulovski in a hyperbaric oxygen chamber at P3 Recovery.Credit: Justin McManus
Sleep, recovery, and readiness scores
First-generation smartwatches merely tracked our health metrics. The modern versions try to turn these data points into scores: sleep scores, recovery scores, even readiness scores.
Loading
Let’s start with sleep. Scientists use brain electrical activity to monitor our sleep and break it up into phases: light, deep, and rapid-eye-movement (REM) sleep. Smartwatches don’t yet have the ability to eavesdrop on our brains, so they try to replicate that data by measuring how much our bodies move as we sleep, combined with heart rate and heart rate variability data.
“It’s all algorithm based,” says Dr Donald Lee, a sleep physician at the Woolcock Institute of Medical Research. “It’s indicative and not authoritative – take it that way.”
What about sleep quality? That also matters: guidelines suggest the best sleep involves falling asleep 15 minutes after your head hits the pillow, waking one or less times a night, and not having extremely high levels of REM or extremely low levels of deep sleep.
Beyond that, is there an optimal amount of REM or deep sleep we should target? “I hear it all the time: I’m not getting enough REM, or enough slow-wave,” says Lee. “There is no great robust evidence that says increasing or decreasing certain stages is beneficial.”
Loading
Even with those limitations in mind, Lee sees a role for smartwatch sleep scores, but suggests you focus on the trend, not on how you did in any individual night. “Be fascinated by the data that comes back from the devices,” he says. If there are problems, talk to a sleep doctor.
That’s sleep. What about recovery?
A small meta-analysis of seven studies on HRV, published in October, concluded heart rate variability did change meaningfully as people went through periods of stress and recovery. A 2023 meta-analysis of 17 studies found various recovery techniques – including massage, cold water immersion, stretching and massage – meaningfully increased HRV.
But just because HRV is a useful metric, it does not mean “recovery” or “readiness” scores are. HRV is a component of these scores, but they are generally proprietary, and the companies do not share how they are calculated. “We can’t get into them to understand how they are developed,” says David Scott. “The reality is, there’s not a lot of evidence behind them as to do they really predict if we’re prepared for peak performance.”
Which leads us to perhaps the most fascinating data-point in recovery: a systematic review by Deakin University researchers looking at what metric best captured how fatigued an athlete was and how well they were recovering.
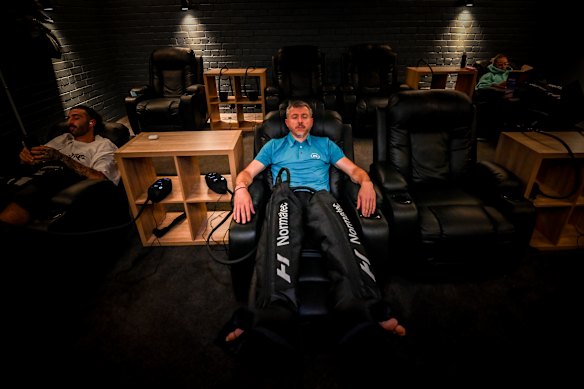
Sekulovski in a pair of compression pants at P3 Recovery Centre.Credit: Justin McManus
The researchers looked at heart rate, blood markers, oxygen consumption, HRV and a bunch of other measures. But one surprise metric beat them all: how stressed or recovered the athletes felt_._
“Your best indicator is how you are feeling physically and mentally,” says Scott. “Don’t become too dependant or get lost in these metrics.”
Loading
Recovery: what really matters
The AIS’s McKune advocates thinking about your recovery strategies like a pyramid. At the bottom are the foundations that everyone needs to get right.
“It’s not going to be anything special,” says McKune. Make sure you’re sleeping seven to nine hours a night. Refuel with carbohydrates and rebuild with protein. Replace lost fluids.
As you go higher up towards the point, “they become more specific to the preferences of the individual athletes”, says McKune. The sort of stuff Stefanos Sifandos has at P3.
Sifandos sees a role for sauna, red light therapy and hyperbaric oxygen – but ultimately agrees with McKune.
The basics are key: sleep, hydration, light movement. “Most people want the hacks,” says Stefanos, “but real recovery is unbelievably simple.”